Deep Learning for Iterative Spectral CT Reconstruction: Replacing Statistical Iterations with an Attention-Based U-Net
Processing input data
append image to sinogram
fix dimension issues using 0 padding
fix multiple of 16 issues using 0 padding
As input data we will append the image to the sinogram. There will be a mismatch in height which we will solve by using 0 padding. Due to the convolution layers in the network, it is desired for the input dimensions to be multiples of 16.
import numpy as np
from libs.simulatepreps import projectMatrix
Define phantom and generate projection matrix
# generate a bone and water phantom with a 32x32 size
## SETTINGS ##
objectSize = 32                         # Object Size a square
nPixelsY = 64                           # Number of pixels on the detector plate.
nPixelsZ = 44                           # Number of pixels on the detector plate.
pixelPitch = 1                          # Pixel pitch
nPixelsPerProj = nPixelsZ * nPixelsY    # The total number of pixels on the detector plate
projections = 32                        # Number of projections


def generatePhantom(size):
    bone_cylinder = np.full((size, size, size), 0.05, dtype=np.float32)
    water_cylinder = np.full((size, size, size), 0.05, dtype=np.float32)

    radius = 0.3 * size
    center = size // 2

    for x in range(size):
        for y in range(size):
            for z in range(size):
                if ((x - center) ** 2 + (y - center) ** 2)<= radius ** 2:
                    if (z > 2 and z < size - 2):
                        bone_cylinder[x, y, z] = 1.0
                        water_cylinder[x, y, z] = 1.0

    return bone_cylinder, water_cylinder

bone, water = generatePhantom(objectSize)
x = np.column_stack((bone.ravel(), water.ravel()))
y, _, _, _ = projectMatrix(x, objectSize, nPixelsY, nPixelsZ, pixelPitch, projections)
define prepareInput and prepareOutput
def prepareInput(y):

    # Curriculum learning input preparation function
    # As an input: 10 channels consisting of empty images next to the sinograms

    # shape: 32x48x96, beginning with a 32x32x32 zero image with padding and a 32x44x64 image with padding

    zeroImage = np.zeros((objectSize, objectSize + 16, objectSize))
    zeroBin = np.zeros((projections, 2, nPixelsY))

    inputs = []

    # we have one dataset per y! with 10 channels (one for bone and one for water)
    for i, bins in enumerate(y):
        # no that is not correct

        # input is 10 channels, zeroimage appended to the energy bin
        bin = bins.reshape((projections, nPixelsZ, nPixelsY))

        # normalize so biggest value is 1, smalles value is 0
        bin = (bin - np.min(bin)) / (np.max(bin) - np.min(bin))

        bin = np.concatenate((zeroBin, bin, zeroBin), axis=1)
        # for input image, concatinate bin to zeroImage in x direction
        input_image = np.concatenate((zeroImage, bin), axis=2)
        inputs.append(input_image)
        inputs.append(input_image)

    return inputs

def prepareOutput(water, bone):

    water = np.flip(water, axis=1)  # flip along z-axis
    water = np.flip(water, axis=2)  # flip along y-axis
    bone = np.flip(bone, axis=1)    # flip along z-axis
    bone = np.flip(bone, axis=2)    # flip along y-axis

    zeroImage = np.zeros((32, 8, 32))
    zeroBin = np.zeros((projections, nPixelsZ + 4, nPixelsY))  # zero bin for the energy bin
    outputs = []

    bone_output = np.concatenate((zeroImage, bone, zeroImage), axis=1)
    water_output = np.concatenate((zeroImage, water, zeroImage), axis=1)

    bone_output = np.concatenate((bone_output, zeroBin), axis=2)
    water_output = np.concatenate((water_output, zeroBin), axis=2)

    outputs = [bone_output, water_output]  # shape will be (10, 32, 44, 64)

    return outputs

# Prepare the input and output data
input = prepareInput(y)
output = prepareOutput(water, bone)
from ipywidgets import interact, IntSlider
import matplotlib.pyplot as plt
energy_bin = 0
#invert the matrix, so z = 0 becomes z = max and y = 0 becomes y = max
flipped_bone_square = np.flip(bone, axis=1) # flip along z-axis
flipped_bone_square = np.flip(flipped_bone_square, axis=2) # flip along z-axis
#in input_square[0], replace [:, 8:40, :32] with the phantom
input[energy_bin][:, 8:40, :32] = flipped_bone_square[:, :, :]
# visualize with a slider, put slider for y value
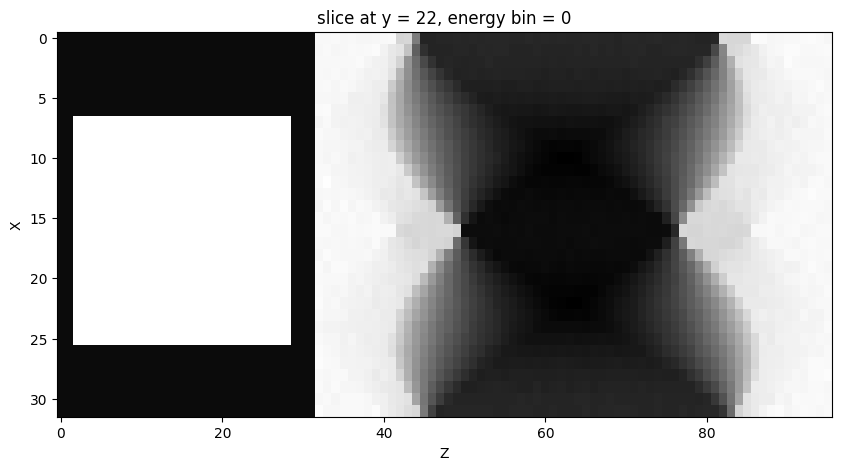
plt.figure(figsize=(10, 5))
plt.imshow(input[energy_bin][:, 22, :], cmap='gray', aspect='auto')
plt.title(f'slice at y = 22, energy bin = {energy_bin}')
plt.xlabel('Z')
plt.ylabel('X')
# draw red rectangle around bottom and top padding
# draw red red rectangle from (0, 0) to (32, 8) and (0, 40) to (32, 48)
plt.show()