Deep Learning for Iterative Spectral CT Reconstruction: Replacing Statistical Iterations with an Attention-Based U-Net
RMS as a function of time
A time-rms plot which includes
rms bune itt against time
rms water itt against time
rms bone model against time
rms water model against time
import pickle
import matplotlib.pyplot as plt
import numpy as np

objectSize = 32


with open('phantom_results_2.pkl', 'rb') as f:
    data = pickle.load(f)

reconstructions = data['reconstructions']
ys = data['ys']
phantoms = data['phantoms']
model_images = data['output_images']
times = data['times']
times_model = data['times_images']
rms_itt_bone = data['rms_reconstructions_bone']
rms_itt_water = data['rms_reconstructions_water']
rms_model_bone = data['rms_models_bone']
rms_model_water = data['rms_models_water']
def rms_error(image1, image2):
    if image1.shape != image2.shape:
        raise ValueError("Images must have the same dimensions")

    # Calculate the squared differences
    squared_diff = (image1 - image2) ** 2

    # Calculate the mean of the squared differences
    mean_squared_diff = np.mean(squared_diff)

    # Return the square root of the mean squared difference
    return np.sqrt(mean_squared_diff)
# calculate RMS for reconstructed images
rms_reconstructions_bone = []
rms_reconstructions_water = []
rms_models_bone = []
rms_models_water = []
for reconstruction, output_image, phantom in zip(reconstructions, model_images, phantoms):
rms_recon_bone = []
rms_recon_water = []
rms_model_bone = []
rms_model_water = []
phantom_bone = phantom[0].transpose() # Get the ith bone
phantom_water = phantom[1].transpose() # Get the ith water
# get first image from reconstruction
_, nMats, nIterates = reconstruction.shape
images = reconstruction.reshape((objectSize, objectSize, objectSize, nMats, nIterates), order = 'F')
for i in range(len(images[0, 0, 0, 0, :])):
image_bone = images[:, :, :, 0, i]
image_water = images[:, :, :, 1, i]
rms_recon_bone.append(rms_error(image_bone, phantom_bone))
rms_recon_water.append(rms_error(image_water, phantom_water))
rms_reconstructions_bone.append(rms_recon_bone)
rms_reconstructions_water.append(rms_recon_water)
for image_bone, image_water in output_image:
rms_model_bone.append(rms_error(image_bone, phantom_bone))
rms_model_water.append(rms_error(image_water, phantom_water))
rms_models_bone.append(rms_model_bone)
rms_models_water.append(rms_model_water)
# we only want te keep the values for the models which are inside the time of the recon
for i in range(len(times_model)):
times_model[i] = [t for t in times_model[i] if t <= max(times[i])]
# and the same for the RMS values
for i in range(len(rms_models_bone)):
rms_models_bone[i] = rms_models_bone[i][:len(times_model[i])]
rms_models_water[i] = rms_models_water[i][:len(times_model[i])]
# Plot the RMS errors for the reconstructions and the models
# make subplot with 1 row and len(reconstructions) columns
# plot them against the times
plt.figure(figsize=(15, 5))
for i in range(3):
time_model = np.array(times_model[i])
time_recon = np.array(times[i])
plt.subplot(1, len(reconstructions), i + 1)
plt.plot(time_recon, rms_reconstructions_bone[i], label='RMS Mechlem Bone', marker='o')
plt.plot(time_recon, rms_reconstructions_water[i], label='RMS Mechlem Water', marker='o')
plt.plot(time_model, rms_models_bone[i], label='RMS Model Bone', marker='x')
plt.plot(time_model, rms_models_water[i], label='RMS Model Water', marker='x')
plt.xlabel('Time (s)')
plt.ylabel('RMS Error')
plt.ylim([0,0.7])
plt.title(f'Phantom {i + 1}')
plt.legend()
plt.tight_layout()
plt.show()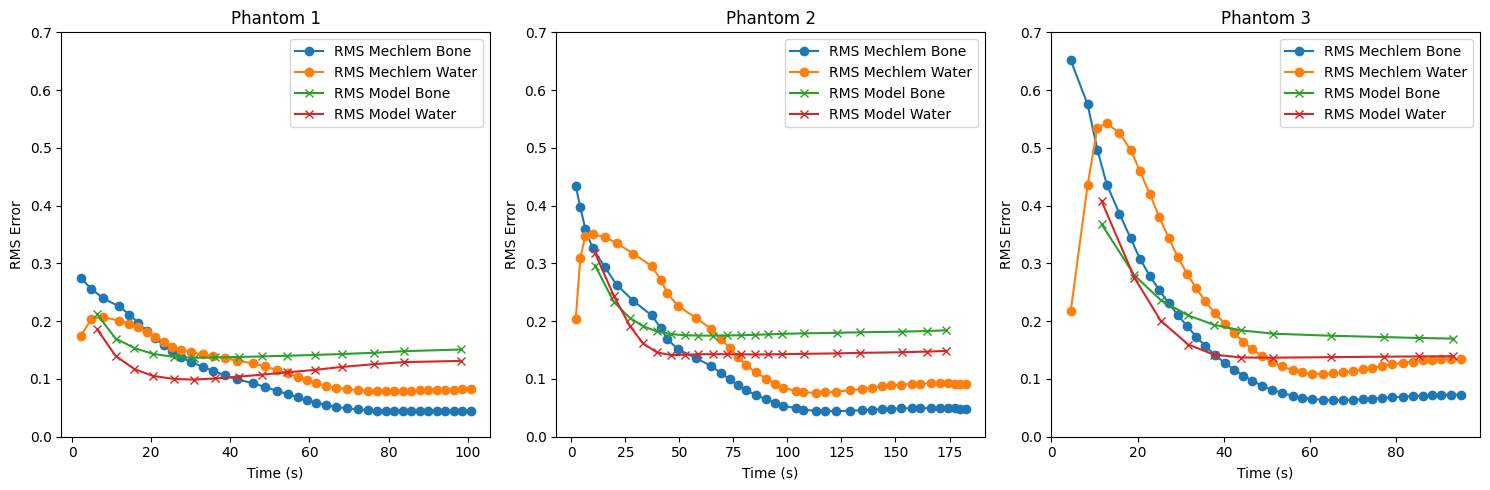
# import interactive slider for displaying images
from ipywidgets import interact, IntSlider


with open('phantom_results_3.pkl', 'rb') as f:
    data = pickle.load(f)

reconstructions = data['reconstructions']
ys = data['ys']
phantoms = data['phantoms']
model_images = data['output_images']
times = data['times']
times_model = data['times_images']
rms_itt_bone = data['rms_reconstructions_bone']
rms_itt_water = data['rms_reconstructions_water']
rms_model_bone = data['rms_models_bone']
rms_model_water = data['rms_models_water']

# loop through reconstructions and display the last bone and water images
# use slider for index in reconstructions array
def display_reconstruction_images(index):
    phantom_bone = phantoms[index][0].transpose()  # Get the ith bone
    phantom_water = phantoms[index][1].transpose()  # Get the ith water


    reconstruction = reconstructions[index]
    _, nMats, nIterates = reconstruction.shape
    images = reconstruction.reshape((objectSize, objectSize, objectSize, nMats, nIterates), order='F')

    fig, ax = plt.subplots(2, 2, figsize=(10, 5))
    ax[0,0].imshow(images[:,:,objectSize // 2, 0, -1], cmap='gray')
    ax[0, 0].set_title('Phantom Bone')
    ax[0, 0].axis('off')
    ax[0, 1].imshow(images[:,:,objectSize // 2, 1, -1], cmap='gray')
    ax[0, 1].set_title('Phantom Water')
    ax[1, 0].imshow(model_images[index][2][0][:, :, objectSize // 2], cmap='gray')
    ax[1, 0].set_title('Model Bone')
    ax[1, 1].imshow(model_images[index][2][1][:, :, objectSize // 2], cmap='gray')
    ax[1, 1].set_title('Model Water')

    plt.show()

interact(display_reconstruction_images,index=IntSlider(min=0, max=len(reconstructions)-1, step=1, value=16, description='Phantom Index'))
Loading...
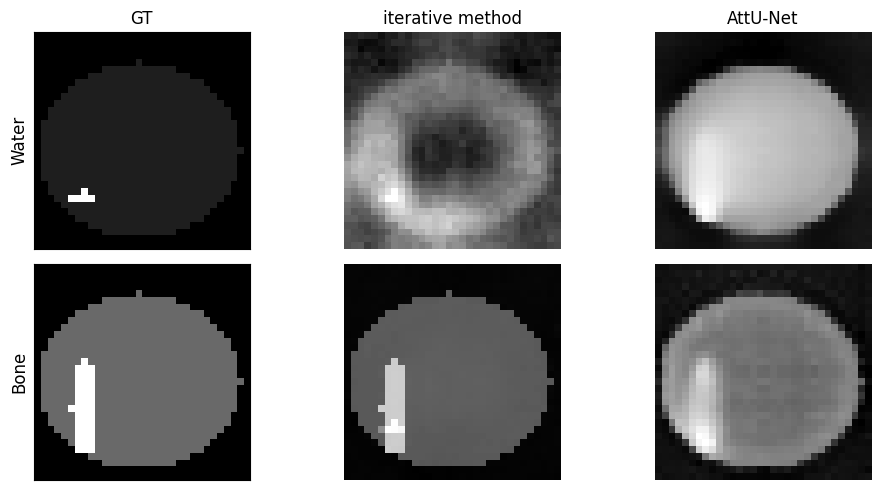
# display phantom 16, make 2x2 plot with the phantom, model and iterative. one row bone one row water
phantom_index = 16
phantom_bone = phantoms[phantom_index][0].transpose()  # Get the ith bone
phantom_water = phantoms[phantom_index][1].transpose()  # Get

# the ith water
reconstruction = reconstructions[phantom_index]
_, nMats, nIterates = reconstruction.shape
images = reconstruction.reshape((objectSize, objectSize, objectSize, nMats, nIterates), order='F')
water_reconstruction = images[:, :, :, 1, -1]
bone_reconstruction = images[:, :, :, 0, -1]

model_bone = model_images[phantom_index][2][0][:, :, objectSize // 2]
model_water = model_images[phantom_index][2][1][:, :, objectSize // 2]

fig, ax = plt.subplots(2, 3, figsize=(10, 5))
ax[1, 0].imshow(phantom_bone[:, :, objectSize // 2], cmap='gray')
ax[0, 0].imshow(phantom_water[:, :, objectSize // 2], cmap='gray')
ax[0, 0].set_title('GT')
ax[1, 1].imshow(bone_reconstruction[:, :, objectSize // 2], cmap='gray')
ax[1, 1].axis('off')
ax[1, 2].imshow(model_bone, cmap='gray')
# turn of axis numbers
ax[1,2].set_xlabel('')
ax[1, 2].axis('off')
ax[0, 2].imshow(model_water, cmap='gray')
ax[0, 2].set_title('AttU-Net')
ax[0, 2].axis('off')
ax[0, 1].imshow(water_reconstruction[:, :, objectSize // 2], cmap='gray')
ax[0, 1].set_title('iterative method')
ax[0, 1].axis('off')
ax[0, 0].set_ylabel('Water', fontsize=12)
ax[1, 0].set_ylabel('Bone', fontsize=12)
ax[0, 0].set_xticks([])
ax[0, 0].set_yticks([])
ax[1, 0].set_xticks([])
ax[1, 0].set_yticks([])
plt.tight_layout()
plt.show()